Phase Properties
Equilibrium Ratios
Note
The main article is: Equilibrium Ratios
The equilibrium ratio (K-value), defined in equation \eqref{eq:def}, is one of the most important thermodynamic quantities for petroleum systems. The reason for this is the direct connection it has on the flash calculation, which is a key phase behavior calculation. Furthermore, the K-values have an intuitive and simple physical meaning. Given a K-value for a specific component at certain conditions, the magnitude will determine the affinity the component has to be in the vapor phase (K-value greater than 1) or the liquid phase (K-value smaller than 1). Theoretically, the K-values can be measured in the lab and an argument can be made that accurate K-value measurements is the best source of PVT data used in equation of state model development.
The shape of the K-value is typically divided into the low-pressure region and the high-pressure region. For the low pressure region the K-values tend to be inversely proportional to the pressure (\(K_i \propto 1/p\)) yielding a -1 slope on a log-log plot and is said to follow Raoult and Dalton’s Law
where \(p_{vi}(T)\) is the vapor pressure of component \(i\). In the high-pressure region, all the K-values appear to converge to unity at the convergence pressure.
Vapor Pressure
The vapor pressure (\(p_v\)) is the equivalent to a pressure-temperature phase envelope for a single component. The definition of the vapor pressure line is defined as the point where starting at a single phase (either vapor like or liquid like), then an increase or decrease in either the pressure or temperature will lead to either a bubble of vapor or droplet of liquid being vaporized or condensed out of solution. Below, the vapor pressure line is shown for ethane.
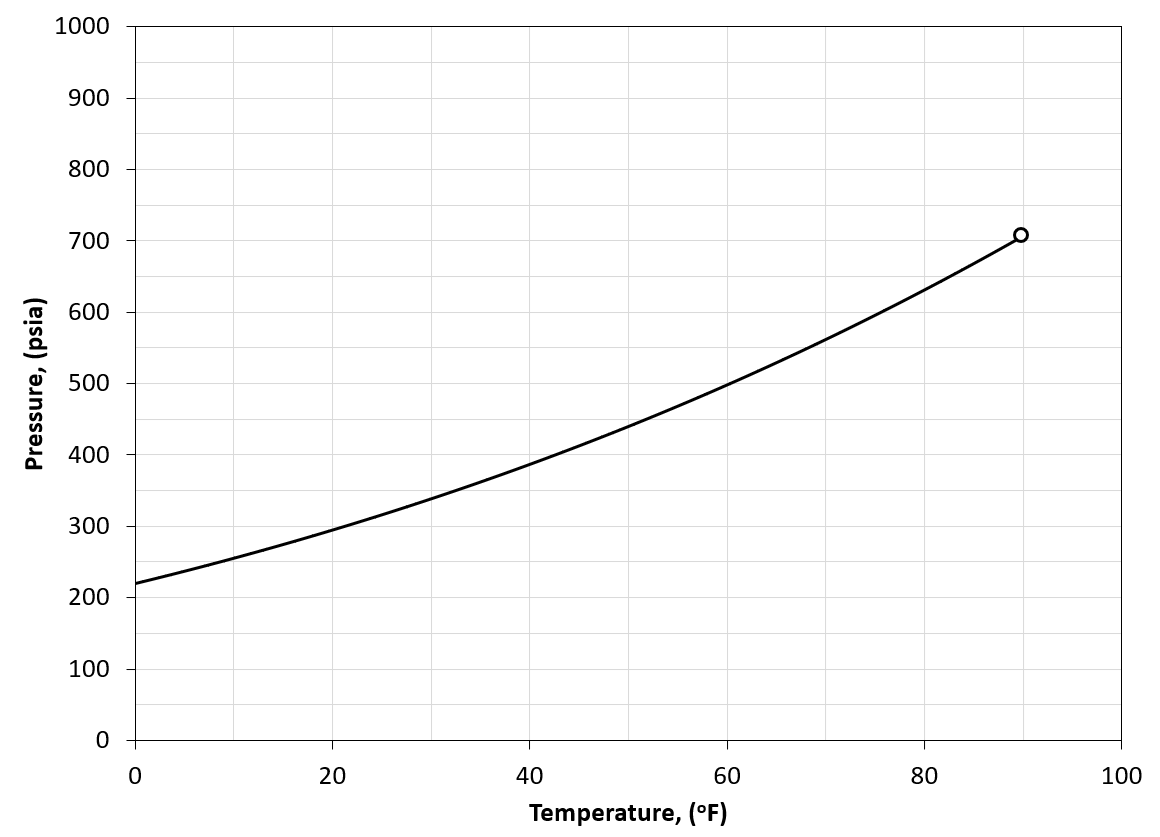
Figure 1: Vapor pressure line in the pressure-temperature plane for \(C_2\) (solid black line) and critical point for \(C_2\) (black circle).
For a pure \(C_2\) mixture to the top-left part of the vapor pressure line will act liquid-like while fluids on the bottom-right of the vapor pressure line will act vapor-like. A single phase fluid moving through the vapor pressure line will experience two phases at the vapor pressure line and nowhere else.
An example of the ambiguous nature of defining single phase fluids as "liquid" or "gas" by plotting the single phase density of pure propane is shown in Animation 1.
Animation 1: Animation showing the ambiguous nature of defining a single phase fluid a liquid or gas. The contour colors are desity for propane and the solid black line is the vapor pressure line for propane. The solid black circle is the critical point of propane.
Saturation Point
A saturation point (ususally denoted with \(_{sat}\)) is a generalized term for any condition (typically pressure and temperature) where an infinitesimal incipient phase occurs. As will be described below, this includes bubble-points dew-points and critical points. The saturation points develop a surface in the the pressure-volume-temperature-composition space which encloses the two-phase region of the fluid. A classic example of a slice of the saturation point curve is the pressure-temperature (or PT) phase envelope. It is interesting to note that any two-phase fluid in thermodynamic equilibrium is at the saturation pressure for each of the two phases respectively.
Dew-Point
A dew-point is a phase behavior property defined by the pressure where an infinitesimal droplet of liquid is released from a single phase vapor at a given temperature and composition.
Animation 2: Animation of a single phase gas reaching its dew-point by decreasing the pressure of the PVT cell. The new phase (incipient oil) is condensed out of the gas phase.
Bubble-Point
A bubble-point is a phase behavior property defined by the pressure where an infinitesimal bubble of vapor is released from a single phase liquid at a given temperature and composition.
Animation 3: Animation of a single phase oil reaching its bubble-point by decreasing the pressure of the PVT cell.
Critical Point
The critical point is the saturation pressure where the dew-point and bubble-point curves meet at a point. There are several unique features of the critical point, namely that (1) the vapor and liquid properties converge to the same values and (2) that the vapor molar fraction becomes arbitrary between the range of 0 and 1.
The formal definition of the critical point is given by
Solutions to the PDE given in equation \eqref{eq:crit_def} are used to derive the cubic EOS models like the van der Waals, Peng-Robinson and Soave-Redlich-Kwong models.
A visualization of the critical state is shown in the figure below for the van der Waals EOS.
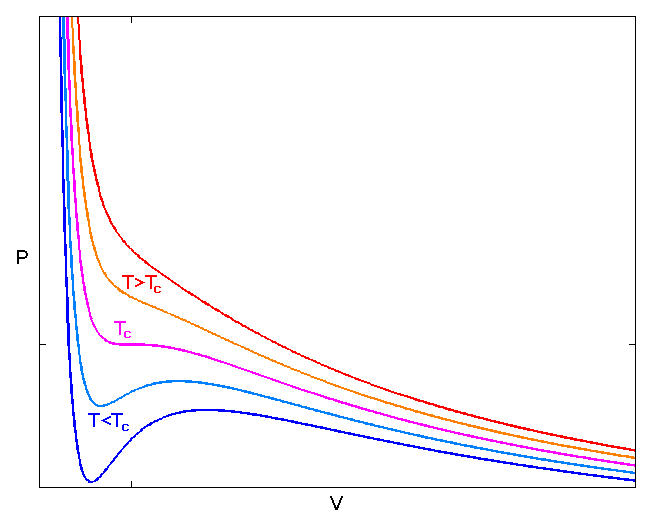
Figure 2: Figure of the van der Waals (vdW) EOS isotherms lines taken from here. The figure shows the shape of the vdW EOS at constant temperatures below (blue lines), at (ornage line) and above (red lines) the critical temperature. The critical pressure is found at the pressure where Equation \eqref{eq:crit_def} is valid.
Convergence Point
The pressure of a fluid mixture at a given temperature where the K-values of all components appear to converge to unity when the isothermal (\(\log (K_i) - \log (p)\)) curves are extrapolated to pressures above the upper saturation pressure (i.e., into the undersaturated pressure region).
The convergence pressure of a fluid mixture with composition zi is the critical pressure for a fictitious “convergence” composition (\(z_{ki}\)) with a critical tie line passing through \(z_{i}\). The convergence pressure can usually be calculated by an EOS model based on the negative flash calculation, where the two equilibrium phase amounts approach ∞ and 1-∞.
Cricondentherm and Cricondenbar
The cricondentherm and cricondenbar are the largest values for the temperature and pressure (respectively) of the PT phase envelope. The cricondentherm is always given for any phase envelope, but certain fluids have the characteristic of the saturation pressure "blowing-up" for low temperatures. For these fluid systems there is no defined cricondenbar.
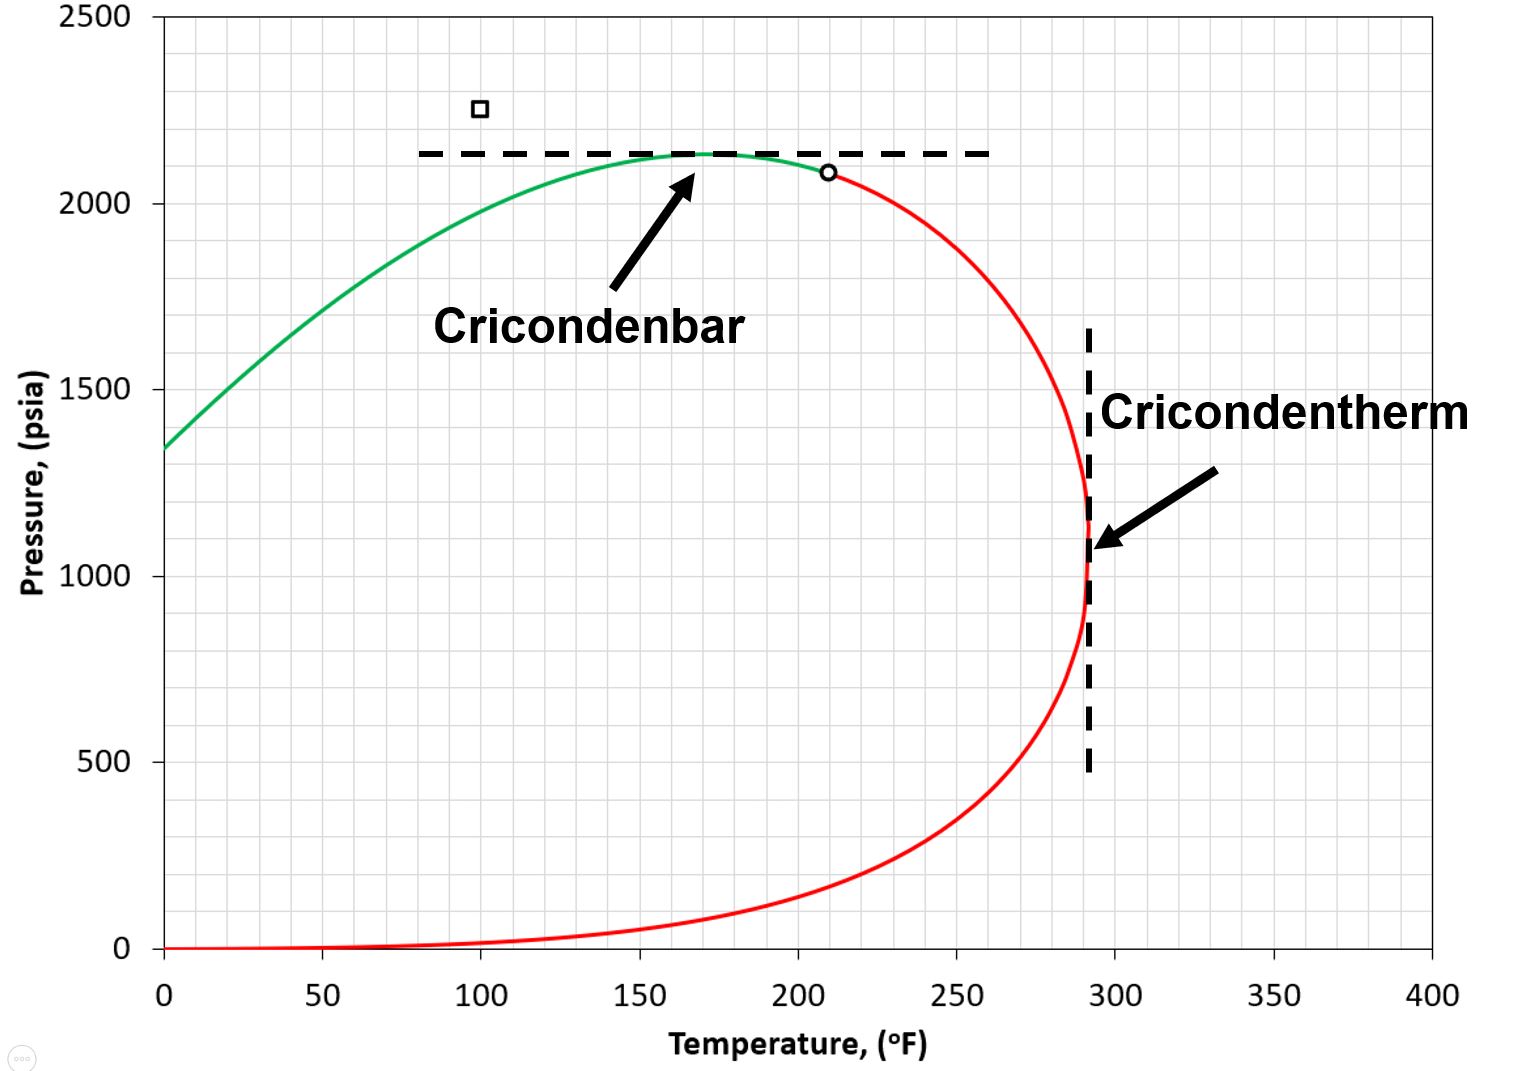
Figure 3: Example of cricondentherm and cricondenbar shown with dashed black lines on a phase envelope.
Split Factor
The molar split factor (\(F\)), typically the vapor molar split (\(F_V\)), is the main regression variable in the isothermal flash inner loop (i.e. the material balance). The generic split factor for phase \(\phi\) is defined by
where \(n_\phi\) is the molar amount of of phase \(\phi\) and \(n\) is the total molar amount in the mixture.
The more specific vapor split factor is given by
where \(n_V\) is the vapor molar amount.
The split factor can be used together with a total composition (\(z_i\)) and an estimate for the K-value to calculate the flashed vapor (\(y_i\)) and liquid (\(x_i\)) compositions.