Additional Quality Controls
In this section, several quality checks that are used in various PVT experiments like CCE, CVD, and DLE or sample validations are presented.
Z-factor Quality Check
To estimate the gas Z-factor, Hall and Yarborough correlations are used. The inputs of the correlations are pseudocritical properties of the gas mixture, \(T_{pc}\) and \(p_{pc}\). To calculate them, we use Sutton correlations, Standing correlations, or Kay's mixing rule. For more information, see the pages Z-Factor and Real Gas Law.
When gas composition is available, Kay's mixing rule is usually applied1.
where the pseudocritical properties of \(\text{C}_{7+}\) can be estimated from Matthews et al. correlations2,
When significant quantities of \(\text{CO}_2\) and \(\text{H}_2\text{S}\) nonhydrocarbon components are present, pseudocritical properties are corrected using Wichert and Aziz correlations3.
where,
If only the gas gravity and nonhydrocarbon content are known, the hydrocarbon specific gravity is first calculated from
Hydrocarbon pseudocritical properties are then calculated using Sutton correlations. These values are adjusted for nonhydrocarbon content based on Kay's mixing rule.
Hall and Yarborough correlations4 are used to calculate the Z-factor. First, the following parameters are calculated.
Then, the reduced-density parameter, \(y\), is obtained by solving
with
An initial value of \(y = 0.001\) can be used with a Newton-Raphson procedure to solve Equation \eqref{eq:hall_y} for \(y\)1. Then, Z-factor is given by
Figure 1 shows an example of Z-factor QC for the data given in this Excel file.
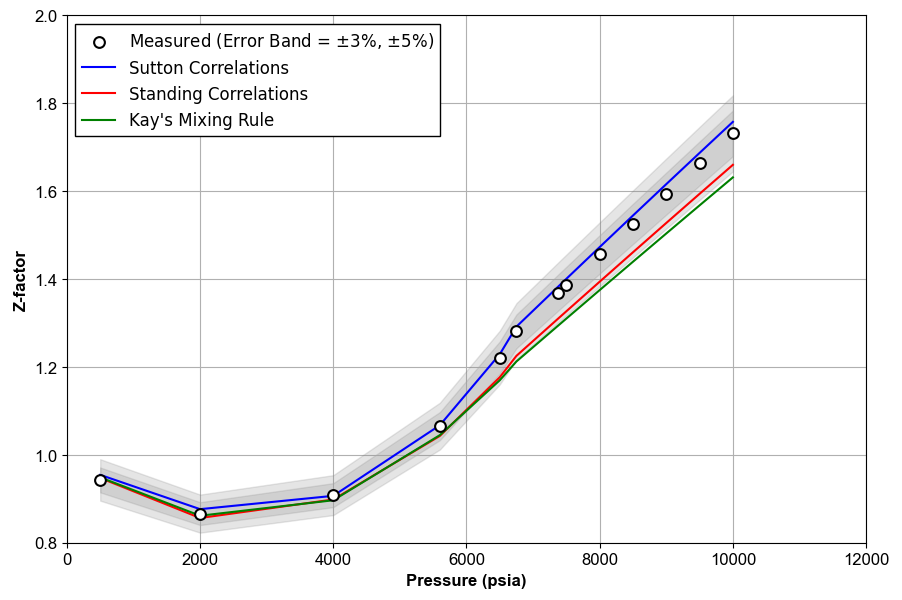
Figure 1: An example of Z-factor QC.
Hoffman et al. K-value Quality Check
Hoffman et al. proposed correlations for prediction of \(K\)-values. Standing used the Hoffman et al. method to generate a low-pressure \(K\)-value equation for surface-separator calculations with \(p_{\text{sep}} < 1000 \text{ psia}\) and \(T_{\text{sep}} < 200\ ^{\circ}\text{F}\). The Standing equations are given below.
First, the parameters of the correlation are calculated.
For all components up to , Table 1 is used for parameters \(b_i\) and \(T_{bi}\).
Table 1 Values of \(b_i\) and \(T_{bi}\) for use in Standing low-pressure \(K\)-value correlation1.
| Component | \(b_i\)(cycle-\(^\circ\)R) | \(T_{bi}\) (\(^\circ\)R) |
|---|---|---|
| N\(_2\) | 470 | 109 |
| CO\(_2\) | 652 | 194 |
| H\(_2\)S | 1136 | 331 |
| C\(_1\) | 300 | 94 |
| C\(_2\) | 1145 | 303 |
| C\(_3\) | 1799 | 416 |
| i-C\(_4\) | 2037 | 471 |
| n-C\(_4\) | 2153 | 491 |
| i-C\(_5\) | 2368 | 542 |
| n-C\(_5\) | 2480 | 557 |
| C\(_6\) | 2738 | 610 |
For \(\text{C}_{7+}\) fraction, the following equations are used.
\(K\)-values are then estimated using
Figure 2 shows an example of Hoffman et al. quality check for a separator test given in this Excel file.
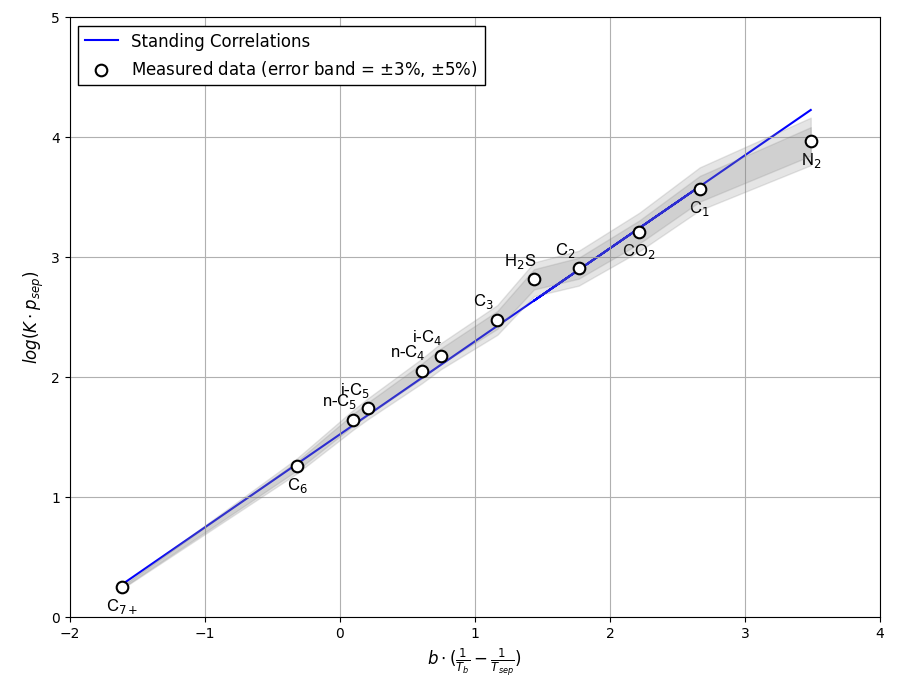
Figure 2: An example of Hoffman et al. QC for a separator test .
References
-
C. H. Whitson and M. R. Brulé. Phase behavior. Volume 20. Henry L. Doherty Memorial Fund of AIME, Society of Petroleum Engineers …, 2000. ↩↩↩
-
TA Matthews, CH Roland, and DL Katz. High pressure gas measurement. Petroleum Refiner, 1942. ↩
-
Edward Wichert and Khalid Aziz. Compressibility factor of sour natural gases. The Canadian Journal of Chemical Engineering, 49:267–273, 1971. ↩
-
K. R. Hall and L. Yarborough. A new equation of state for z-factor calculations. Oil Gas J, 71:82, 1973. ↩