Constant Volume Depletion
The constant volume depletion (CVD) experiment is one of the standard depletion experiments. The main outputs of the CVD experiment are the liquid drop-out curve and consequently the approximate saturation pressure. A series of experiments is typically conducted on the produced fluid as well (e.g. gas Z-factor). The CVD experiment emulates the depletion of gas condensate to a certain extent, and has been used in the methodology by Whitson and Torp1 to develop black-oil properties.
Procedure
The procedure for CVD experiment is shown as an animation and as a schematic below. A PVT-cell is filled with a fluid sample and pressurized to the saturation pressure. The PVT-cell volume is then expanded at a constant temperature, reducing the pressure. Once the pressure is below the saturation pressure, the incipient phase is either condensed or vaporized out of the solution. When the PVT-cell volume has reached a certain value, gas (and potentially oil) is removed until the PVT-cell volume is the same as the initial volume (keeping the pressure constant). This procedure is repeated a number of times and the produced fluids are analyzed. If the PVT-cell is a visual cell, then the liquid and vapor volumes can also be reported.
Animation 1: Animation of a CVD procedure for a saturated gas reservoir.
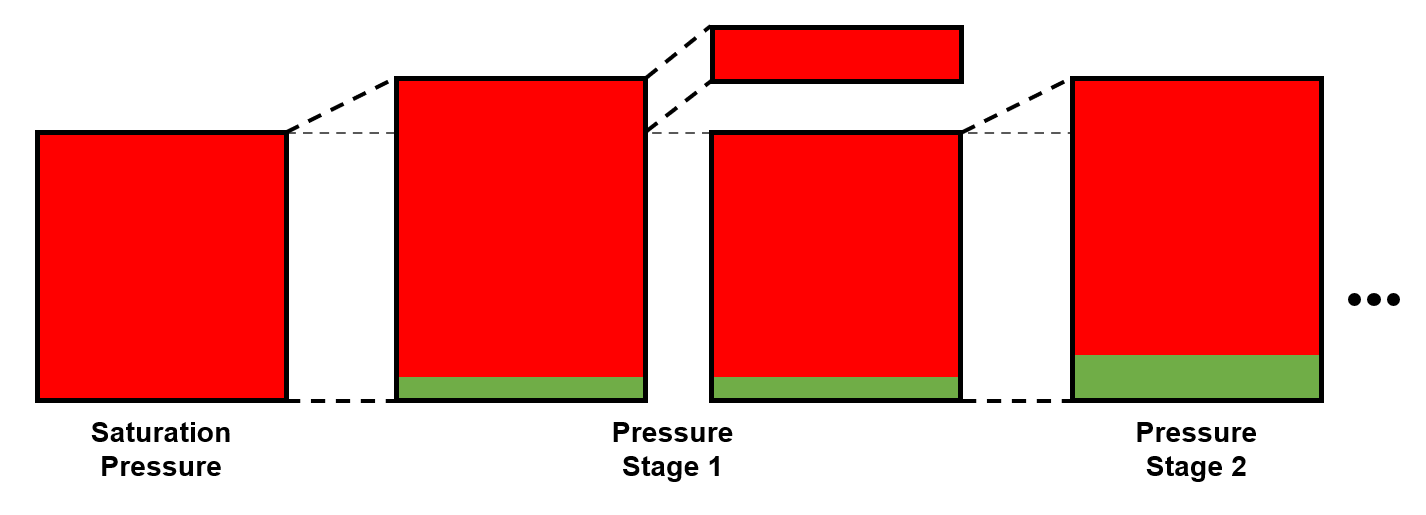
Figure 1: Schematic of a CVD experiment for a saturated gas reservoir.
Results
The main results of the CVD experiment is the relative volume, and a range of properties of the removed gas; the gas Z-factor and gas specific gravity.
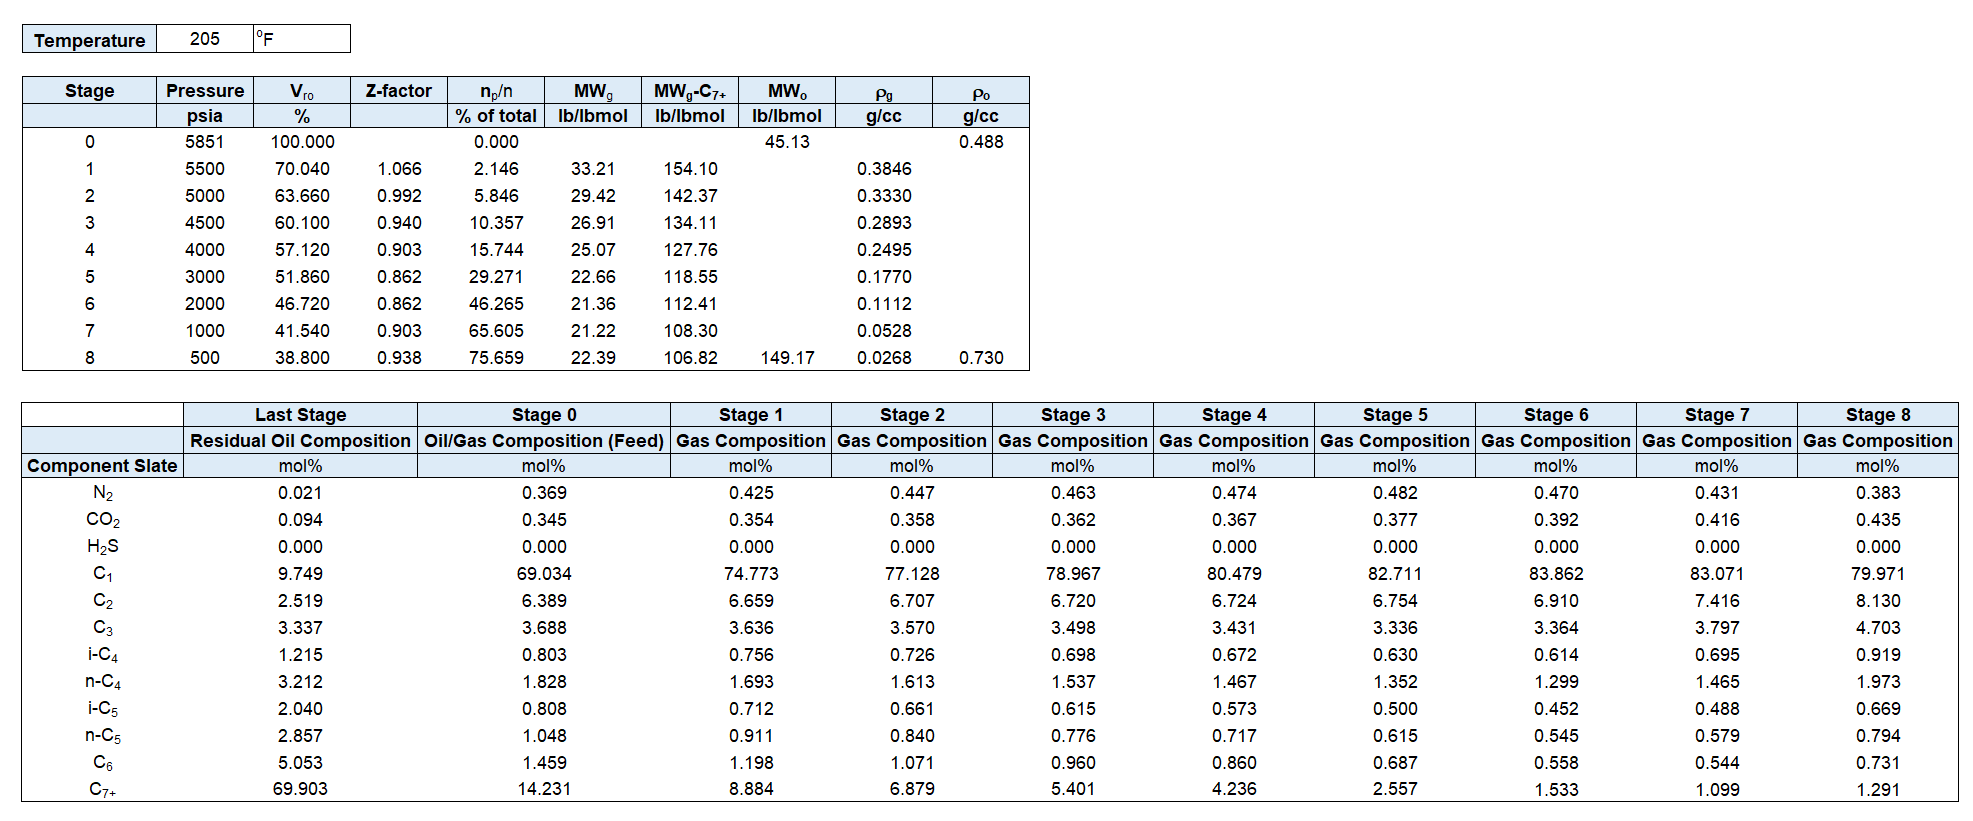
Table 1 and Figures 2 to 4 shows the CVD data for a gas-condensate sample.
Table 1 CVD data for Good Oil Co. Well 7 gas-condensate sample.2
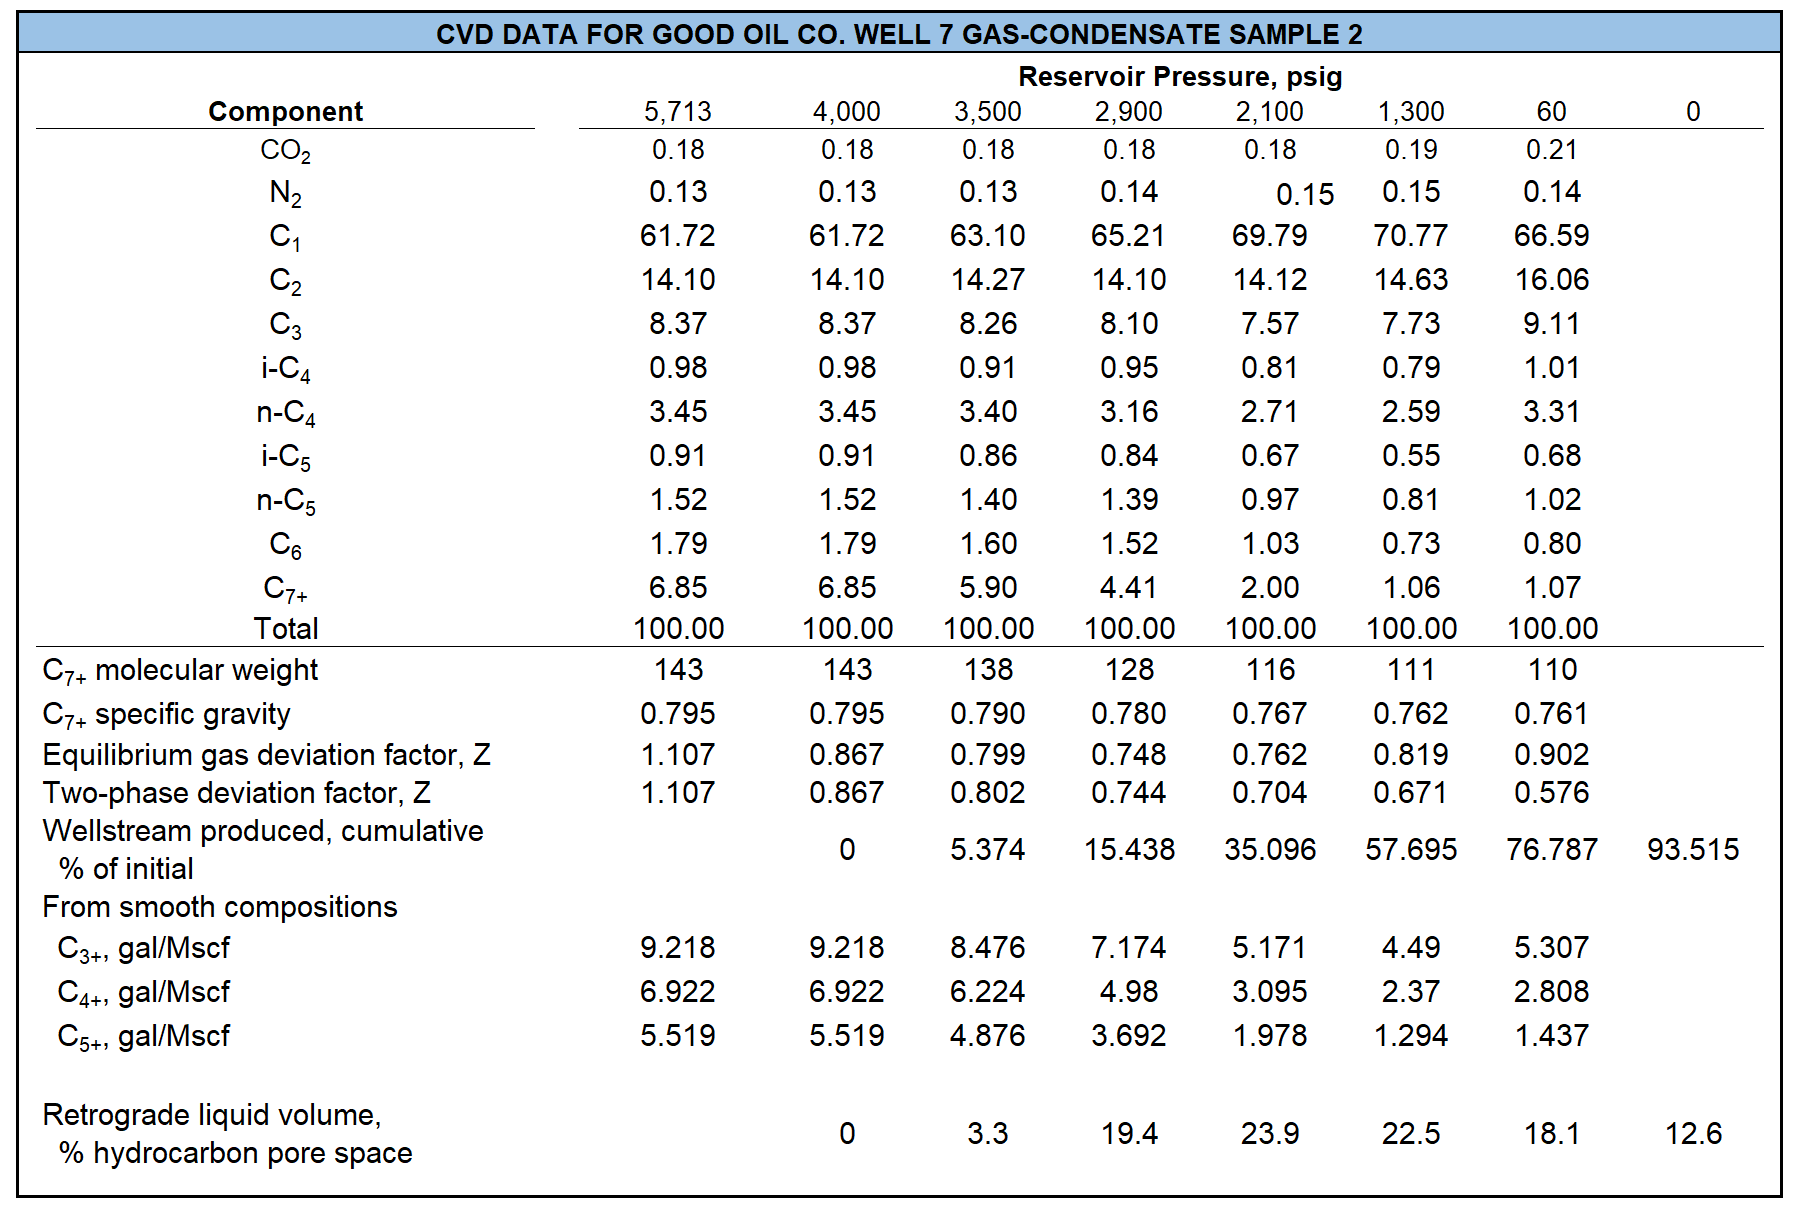
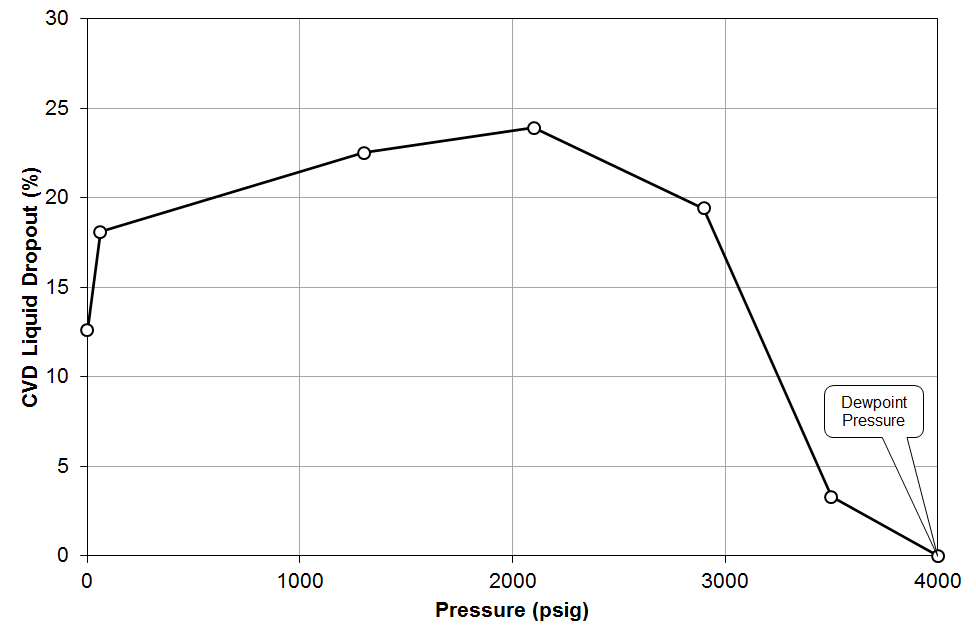
Figure 2: CVD data for a gas-condensate sample from Good Oil Co. Well 7; liquid-dropout curve.
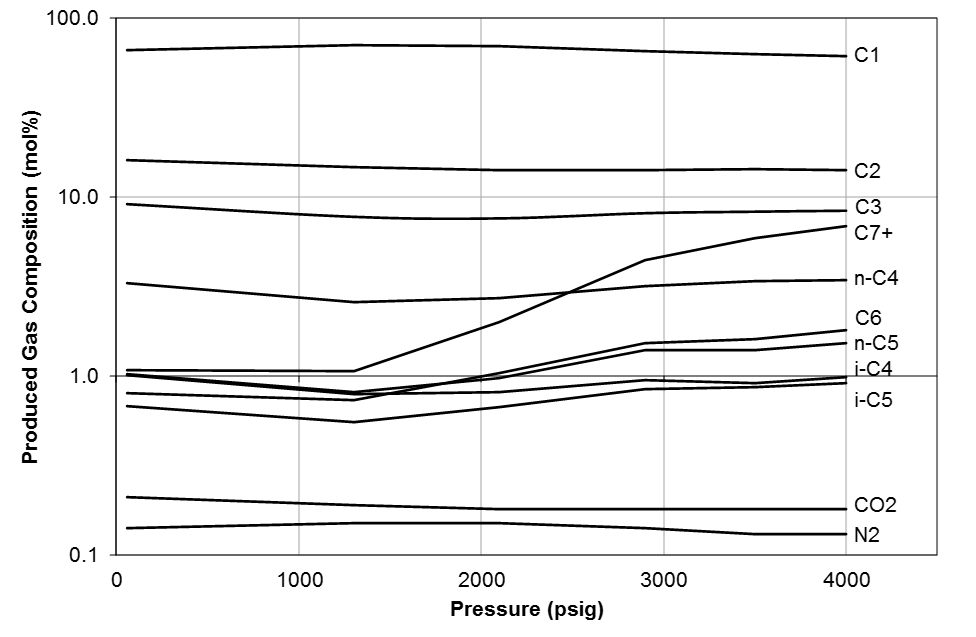
Figure 3: CVD data for a gas-condensate sample from Good Oil Co. Well 7; equilibrium gas compositions.
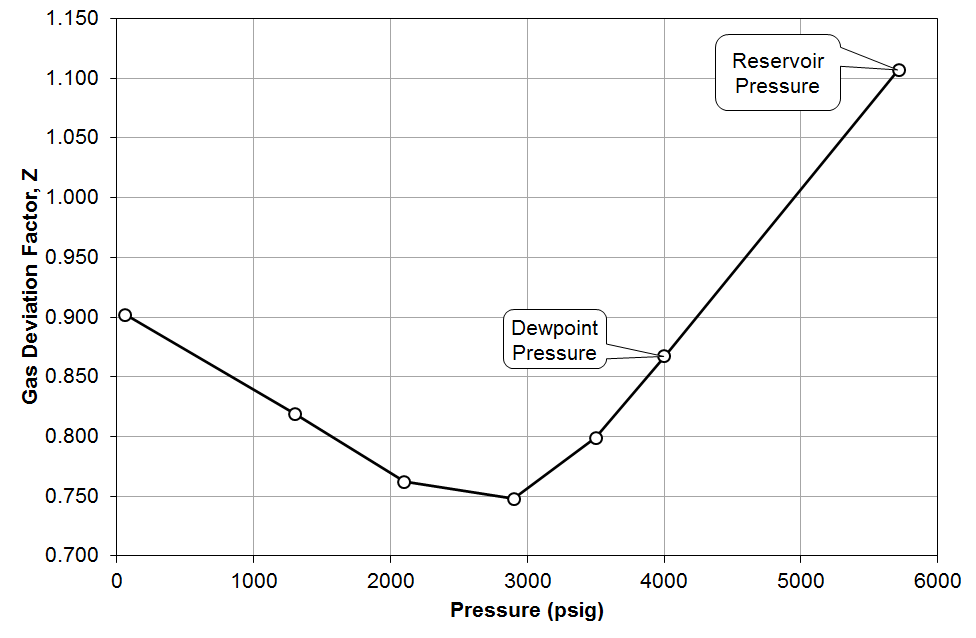
Figure 4: CVD data for a gas-condensate sample from Good Oil Co. Well 7; equilibrium gas Z-factor.
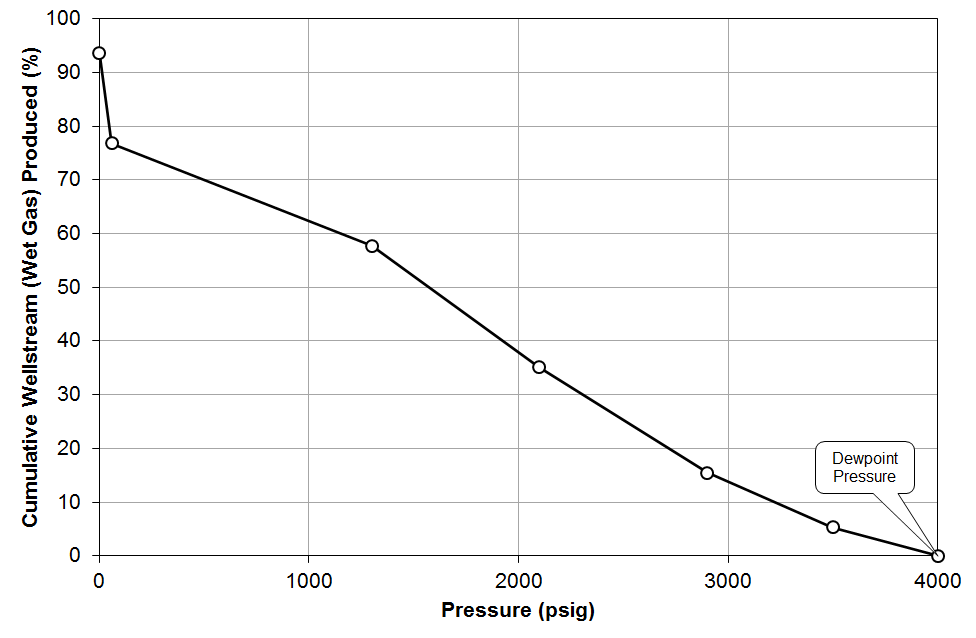
Figure 5: CVD data for a gas-condensate sample from Good Oil Co. Well 7; wet-gas material balance.
Quality Control / Quality Assurance
To check the consistency of the CVD data, material balance is used to back-calculate the oil and gas densities at each stage and the compositions of the feed and residual oil. Then, they are compared against the reported values. Let's do these, step by step.
A template of the CVD test data is given in the table below.
Table 2 CVD test data template (download Excel file).
Oil and Gas Density Material Balance
To check the consistency of the CVD data or quality of the reported densities, the oil and gas densities are back-calculated. The gas density is estimated using the real gas law using the gas molecular weight and the Z-factor. Noting that the cell volume is constant, the gas and oil volumes are calculated. Then, the gas moles is calculated using real gas law and the oil moles and oil density are then obtained.
By assuming \(n=100 \text{ lbmol}\) at stage \(k=0\), the oil and gas densities are calculated in the following steps.
Moles produced at stage \(k\) is given by
where \( (n_p /n)_k \) is the wellstream produced (cumulative percentage of initial).
Either \(MW_g\) or \(MW_{\text{C}_{n+}}\) (or both) must be given. If the gas molecular weight is not given, it can be estimated using the component molecular weights.
Using real gas law, the gas density is estimated as
The cell volume can be calculated using the information given at the dewpoint.
Then, the oil and gas volumes in the cell at stage \(k\) will be
and
where, \(V_{ro}\) is the liquid dropout percentage.
Total moles remaining in the cell at stage \(k\) is given by
Then, the gas and oil moles can be calculated as
and
Moles are converted to mass in the following steps
Molecular weight and density of the oil are calculated as
and
By implementing the procedure given above, a plot like Figure 6 will be obtained.
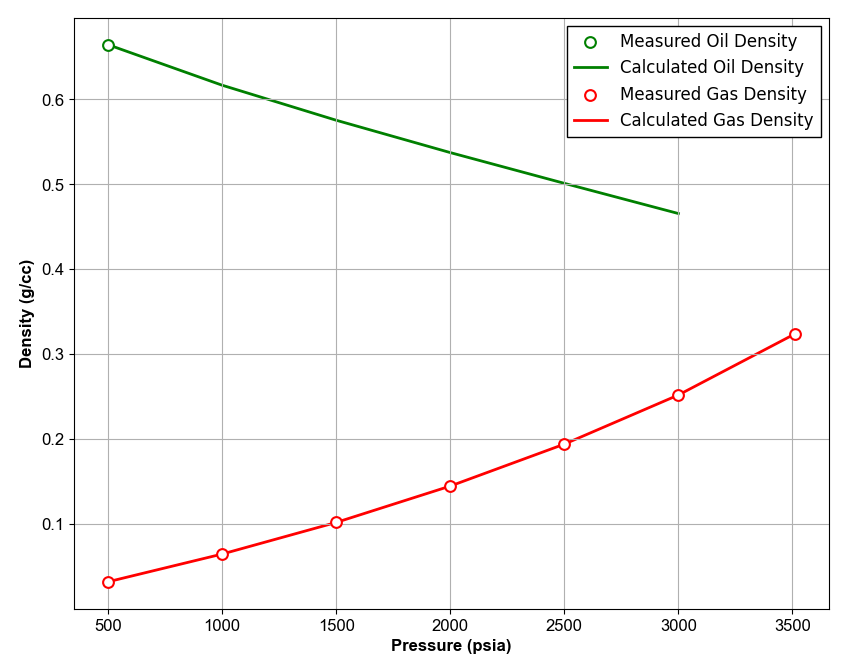
Figure 6: Oil and Gas Densities QC Example.
K-Values
One way to check the quality of CVD data is checking the k-value plot visually. To calculate the K-values, compositions of the equilibrium liquid and gas phases are required. The gas composition is reported and the liquid composition is calculated using material balance equation.
Overall composition of the remaining mixture in the cell at stage \(k\) is given by
Then, the composition of the liquid remaining in the cell at stage \(k\) is calculated by
Hence, K-values can be calculated as
The result will be a plot like shown below.
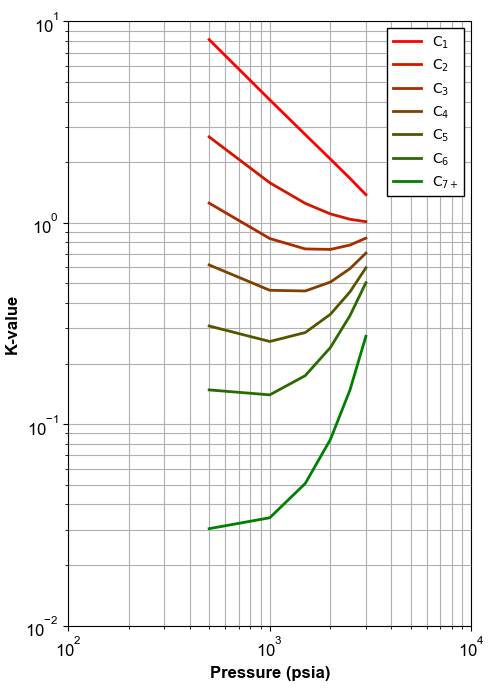
Figure 7: An example of K-values calculated using material balance.
Feed Composition
To check the quality of the reported feed composition, it is back-calculated and compared against the reported values. Starting from the residual oil, the removed gas components at each stage are added backward. For the oil and gas moles, different approaches can be decided as explained later in the following.
The feed composition (at stage \(k=0\)) can be back-calculated as
Using the above equation, three approaches can be selected:
- Calculate \((n_o)_{\text{residual}}\) from residual oil properties, and \(n_g\) from gas volume and Z-factor
- Calculate \((n_o)_{\text{residual}}\) from residual oil properties, and \(n_g\) from \(n_g=n_t-n_o\)
- Calculate \((n_o)_{\text{residual}}\) from forward material balance
Residual Oil Composition
To check the quality of the reported residual oil composition, material balance equation can be applied for the last stage. The mole amount of the overall mixture and the gas phase in the last stage are calculated using forward material balance.
The molar composition of the component \(i\) in the residual oil is given by The values of \((n_t)_k\), \((n_g)_k\) and \((n_o)_k\) are calculated using Equations \eqref{eq:np} to \eqref{eq:no}.
The procedure described above is for a gas condensate sample. The procedure is almost similar for volatile oils, but a little modifications are required. For example, instead of using Equation \eqref{eq:cell_volume}, the cell volume is calculated using the following equation.
References
-
C. H. Whitson and S. B. Torp. Evaluating constant volume depletion data. In SPE Annual Technical Conference and Exhibition, paper SPE–10067–MS. Society of Petroleum Engineers, 1981. doi:https://doi.org/10.2118/10067-MS. ↩
-
C. H. Whitson and M. R. Brulé. Phase behavior. Volume 20. Henry L. Doherty Memorial Fund of AIME, Society of Petroleum Engineers …, 2000. ↩