Laboratory Multi-Stage Separator
The laboratory multi-stage separator (MSS) test is in a essence the same as a differential liberation experiment, but with variation in the temperature as well as the pressure. The MSS test is emulating the separator process and was originally used to model the separator process, but like all the PVT experiments is now used to fit a fluid model the fluid system.
Procedure
The procedure for the MSS experiment is shown as an animation and as a schematic below. A PVT-cell is filled with a single-phase fluid sample at the initial reservoir pressure and temperature. The PVT-cell volume is then expanded and cooled/heated to a new temperature, reducing the pressure. When the PVT-cell volume has reached a certain value (pressure is equal to the first stage separator pressure), all the gas is removed (keeping the pressure constant). This procedure is repeated for all the separator stages.
Animation 1: Animation of a laboratory MSS procedure for a saturated reservoir oil.
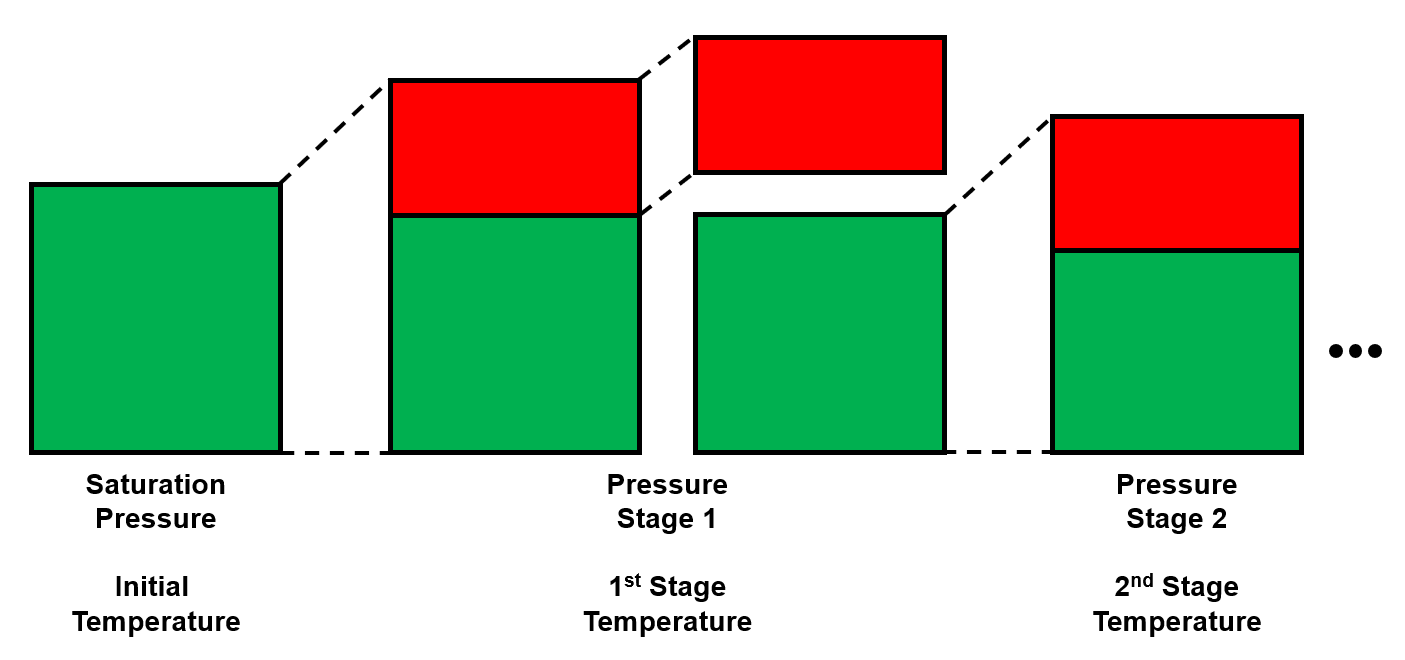
Figure 1: Schematic of a laboratory MSS experiment for a saturated reservoir oil.
Results
The main results of the MSS experiment is the separator GOR and formation volume factor as well as the separator densities. This data is particularly useful in EOS model development as it is the only data that spans all directions in p-T-z space.
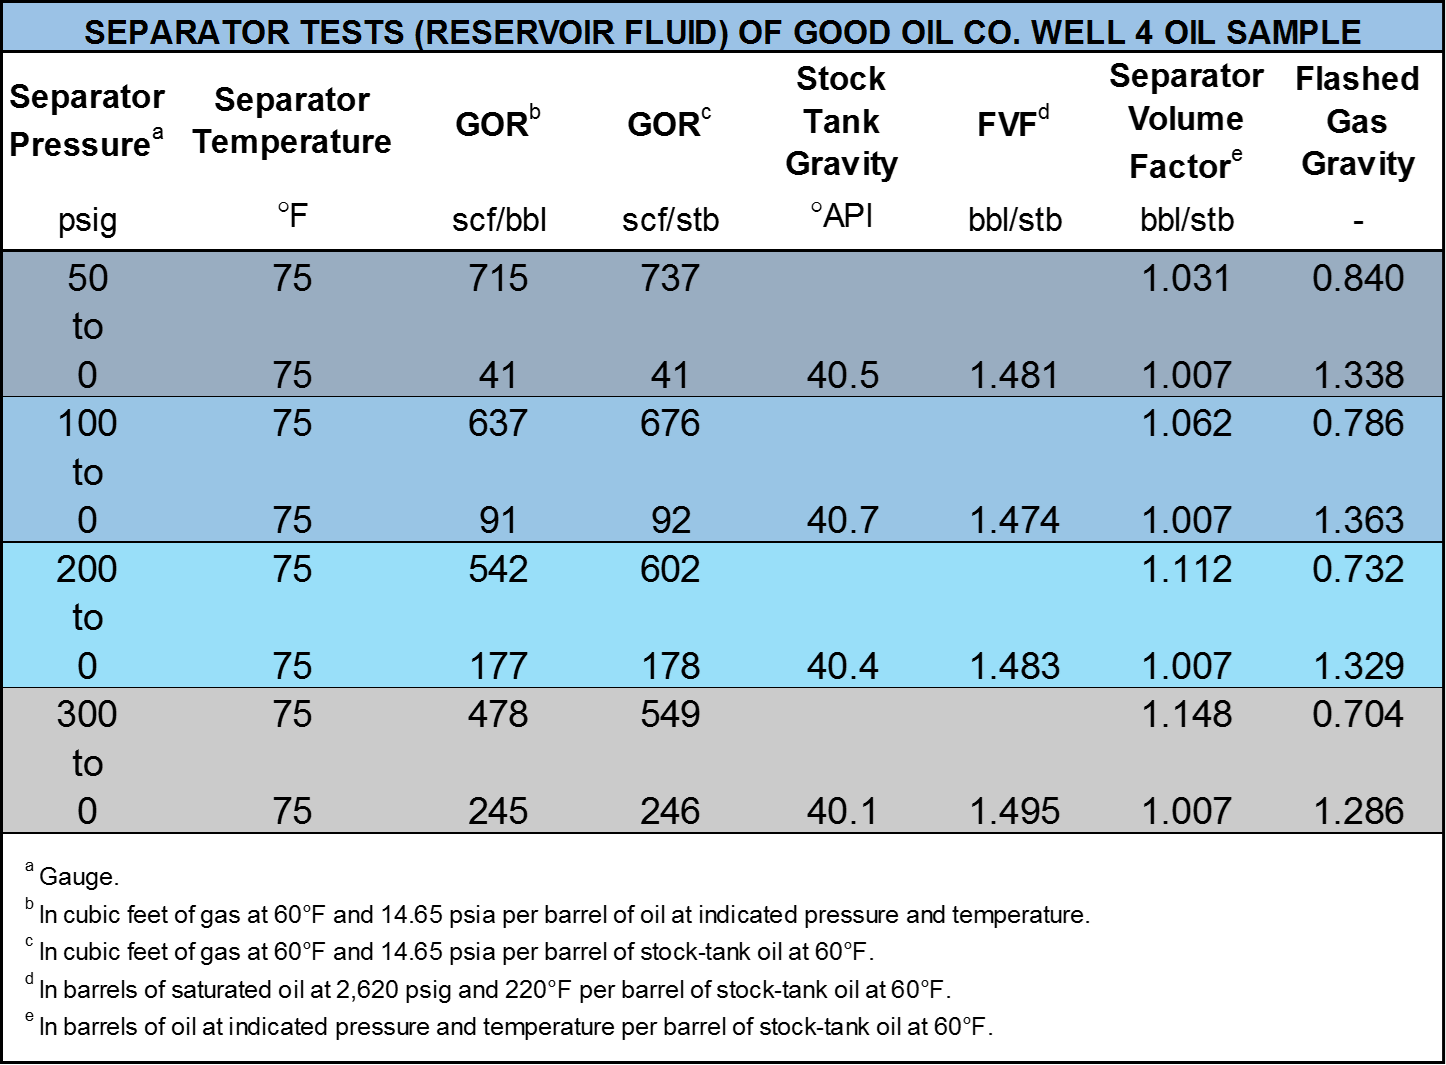
Table 1 shows the results of four MSS experiments each consisting of two stages of separation.
Table 1: MSS data for Good OIL Co. Well 4. Each test is shown with a different color.1
Quality Control / Quality Assurance
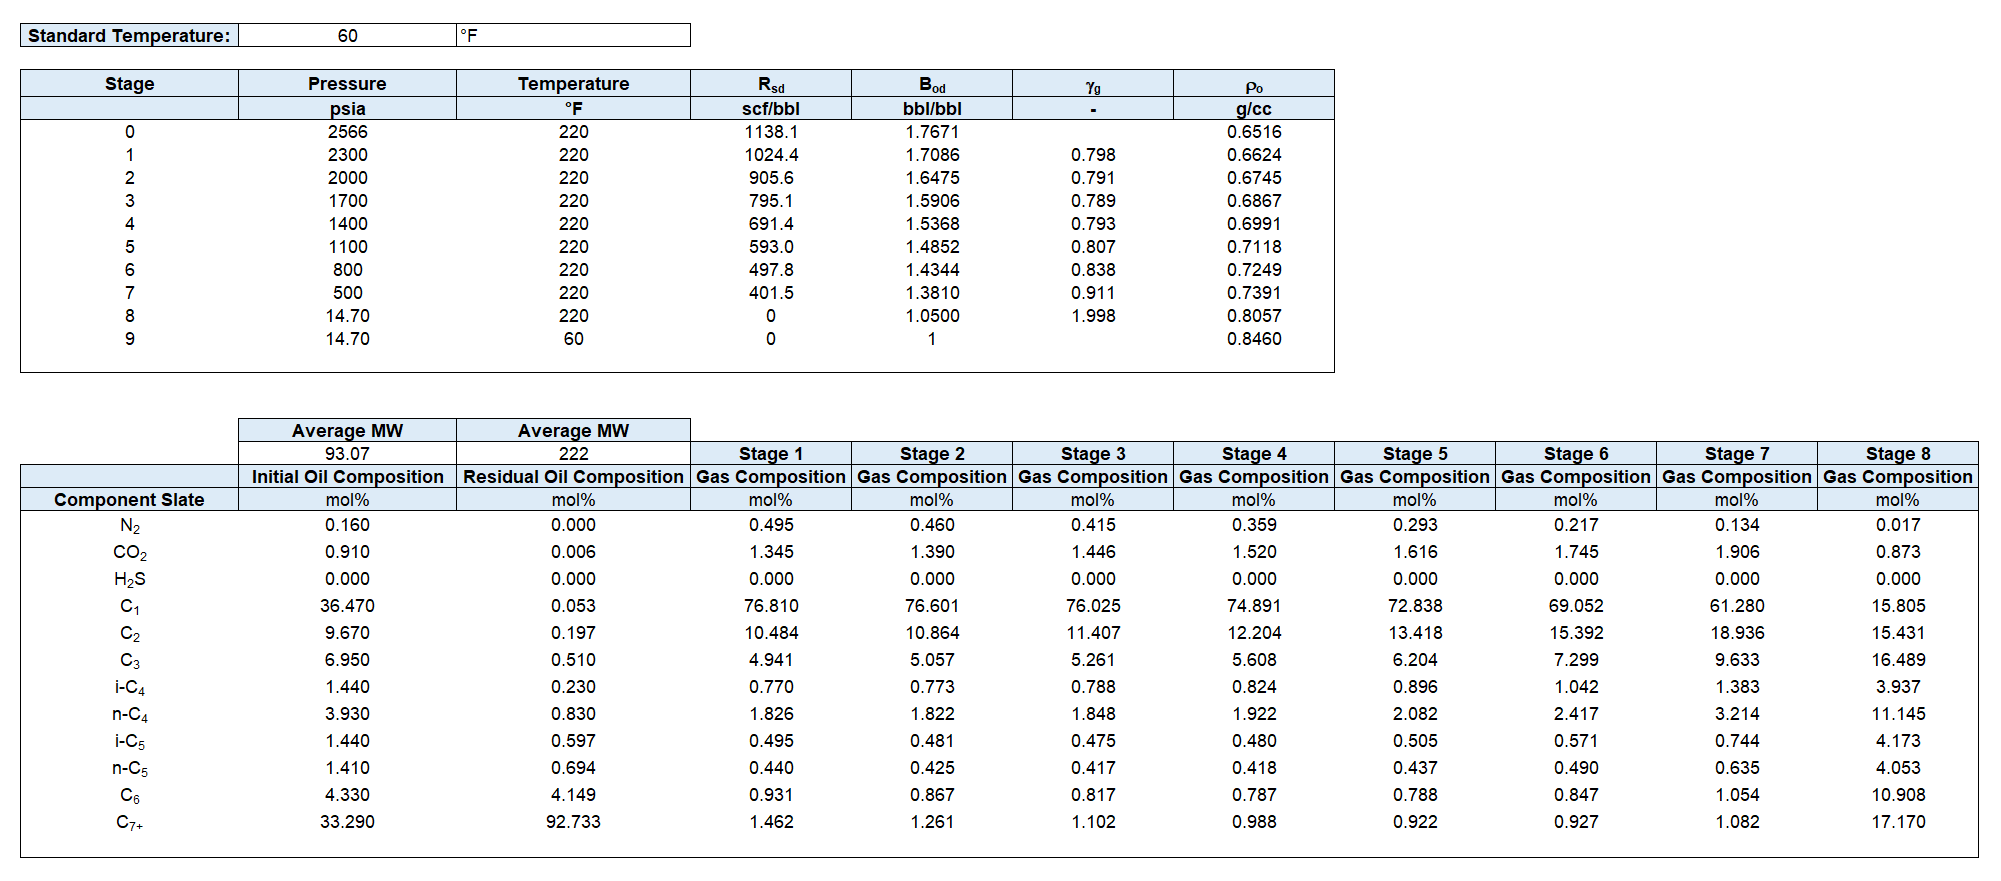
To check the quality of the lab MSS data, material balance is used to back-calculate the oil density and the initial fluid composition. Then, they are compared against the reported values. At the end, k-values are estimated and plotted for a visual quality check. A template of the MSS test data is illustrated in the table below.
Table 2 Lab MSS test data template (download Excel file).
Oil Density Material Balance
Starting at the bubble point (\(k=0\)), for stages \(k={1,...,N-1}\), the mass of the removed gas is calculated.
For each stage, the moles of the removed gas is calculated using the ideal gas law. Note that \((V_{gd})_{k}\) is usually reported as a GOR.
Using the molecular weight of the gas, that can be calculated from the gas specific gravity measured in the stage, the moles to are converted to the mass.
By combining Equations \eqref{eq:ngd} to \eqref{eq:mgd},
At the last stage \(k=N\), only residual oil is left in the cell and its mass can be calculated using the measured oil density:
Starting from residual oil and adding differential mass of the removed gas at each stage (going backward from \(k=N-1\) to \(k=0\)), the oil mass at each stage is obtained. Hence, the oil density at each stage will be
By implementing the above procedure, you will obtain a plot like Figure 2.
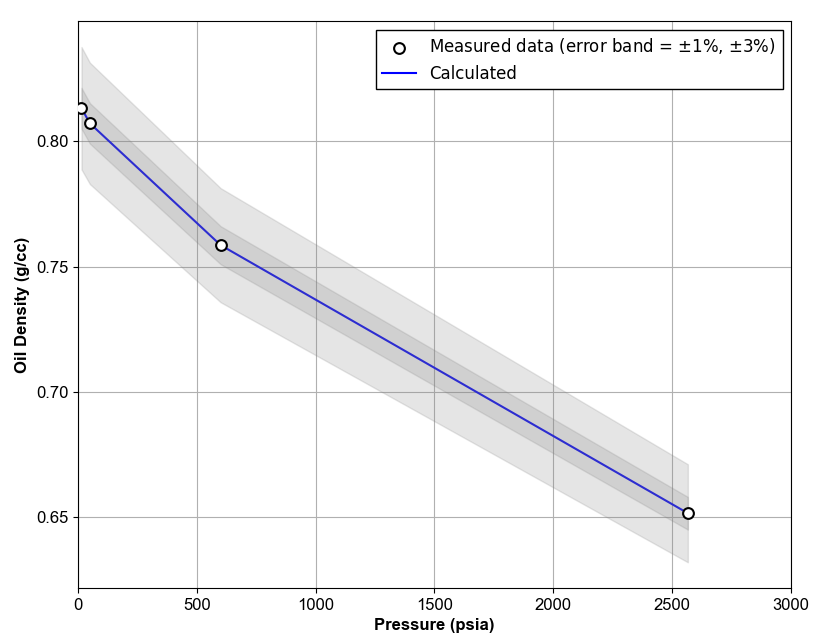
Figure 2: Oil Density QC Example.
The rest of the QC calculations are same as QC for differential liberation experiment.
References
-
C. H. Whitson and M. R. Brulé. Phase behavior. Volume 20. Henry L. Doherty Memorial Fund of AIME, Society of Petroleum Engineers …, 2000. ↩