Differential Liberation Expansion
The differential liberation experiment (DLE or DL) or differential vaporization is one of the standard depletion experiments. The main output of the DLE experiment is the oil formation volume factor, GOR and oil viscosity. The DLE was originally made to emulate the depletion production of oil reservoirs.
Procedure
The procedure for DLE experiment is shown as an animation and as a schematic below. A PVT-cell is filled with a fluid sample and pressurized to the saturation pressure. The PVT-cell volume is then expanded at a constant temperature, reducing the pressure. Once the pressure is below the saturation pressure, the incipient phase is either condensed or vaporized out of solution. When the PVT-cell volume has reached a certain value, all the gas is removed (keeping the pressure constant). The DLE experiment is basically the same experiment as the multistage separator test but at a constant temperature.
Animation 1: Animation of a DLE procedure for a saturated reservoir oil.
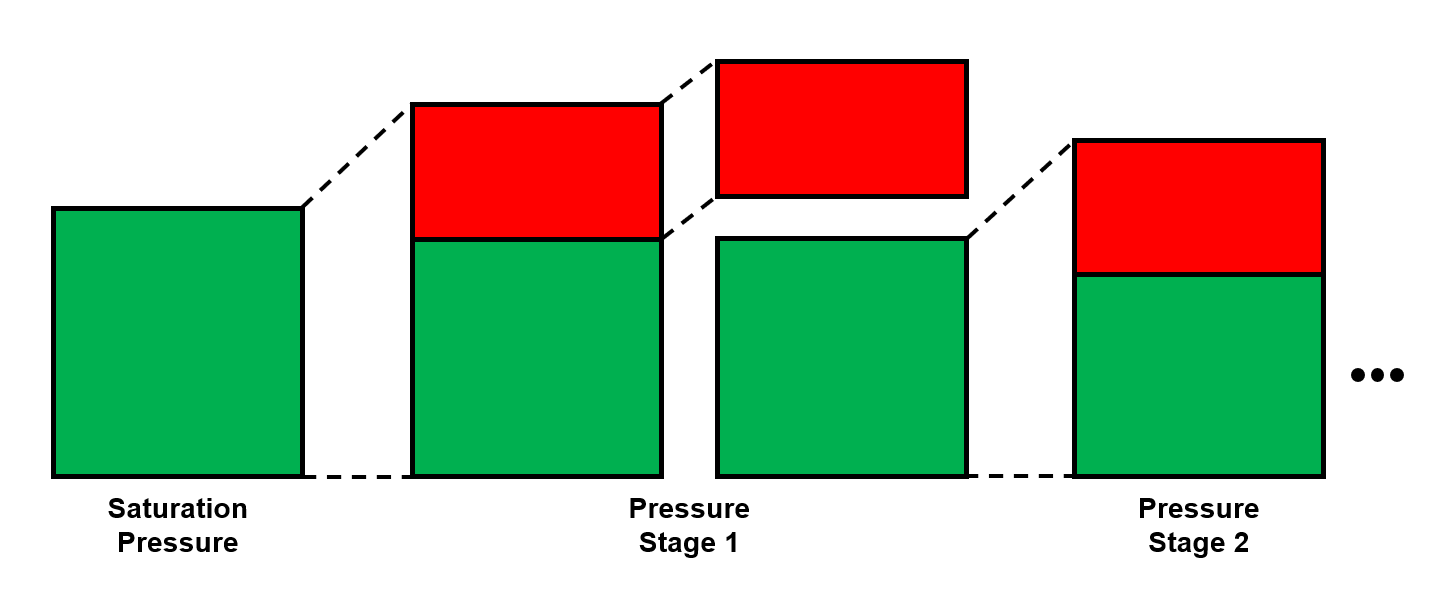
Figure 1: Schematic of a DLE experiment for a saturated reservoir oil.
Results
The main results of the DLE experiment is the relative volume at different pressure and
a range of properties for the removed gas at each stage: gas Z-factor and specific gravity.
The density of the oil can also be measured for the undersaturated region. The DLE GOR can
also be reported (either directly or indirectly).
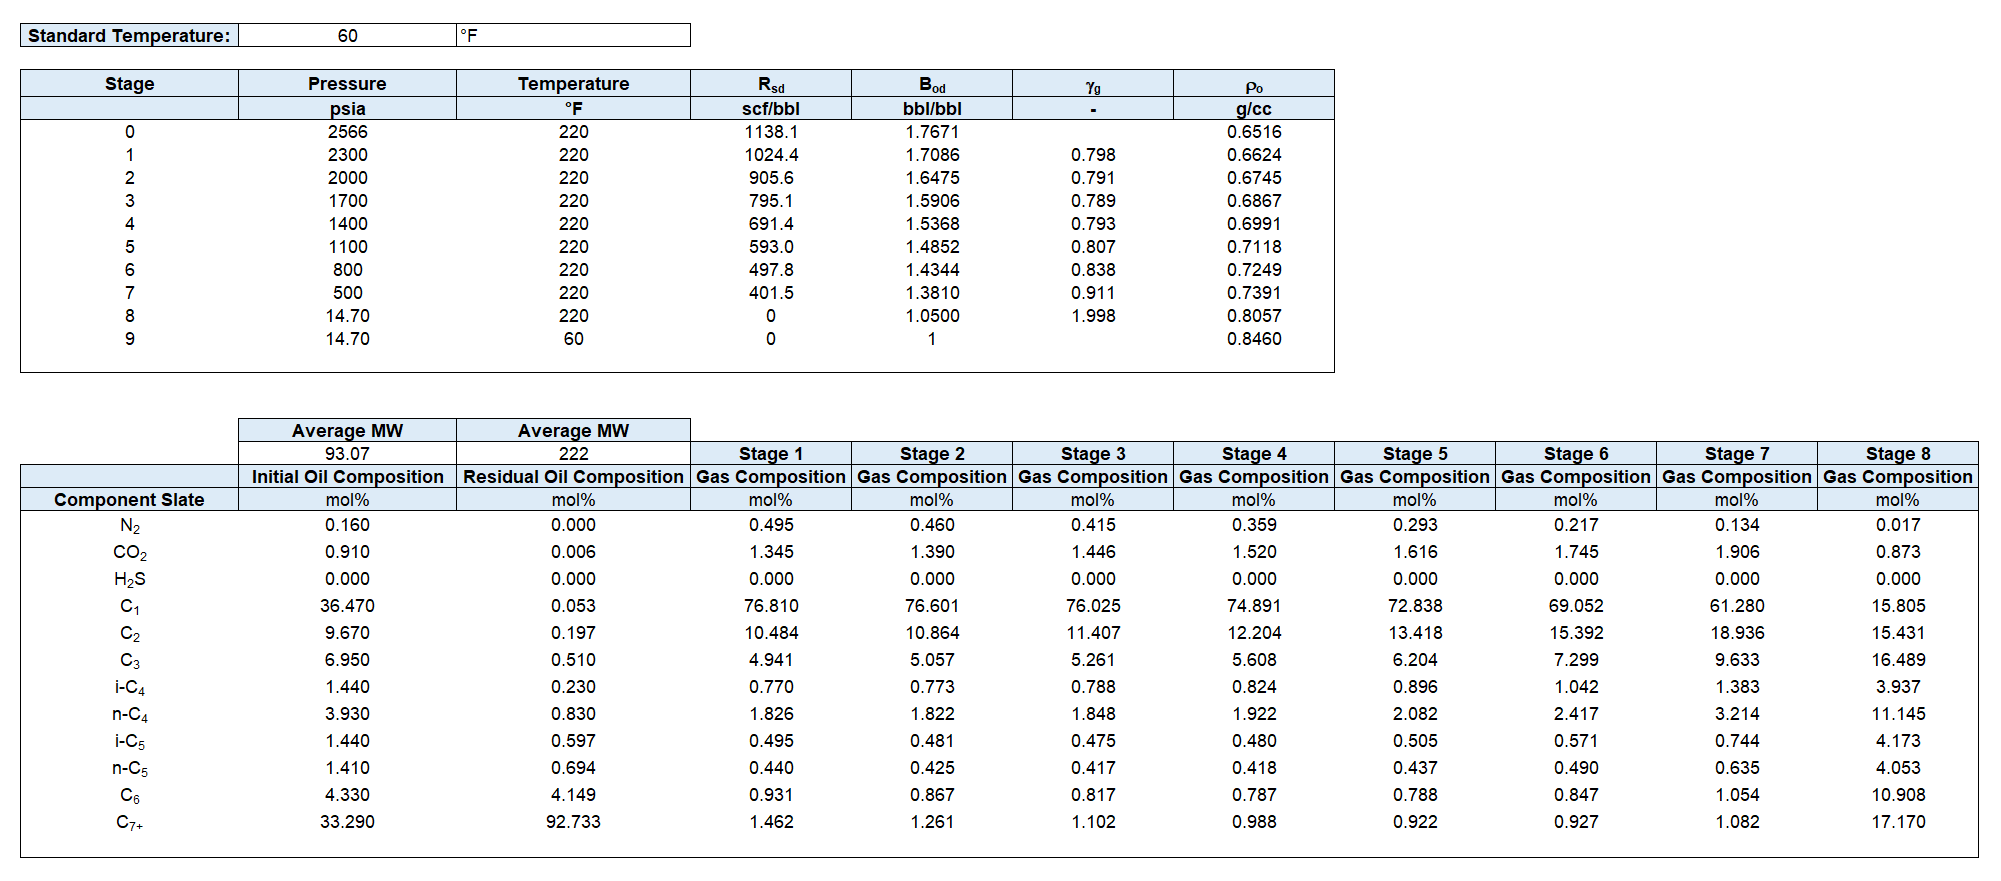
Table 1 shows the results of a DLE experiment. Figures 2 to 4 show the plots of GOR, oil FVF, and oil viscosity.
Table 1: DLE data for Good OIL Co. Well 4, for undersaturated (gray) and saturated (white) regions.1
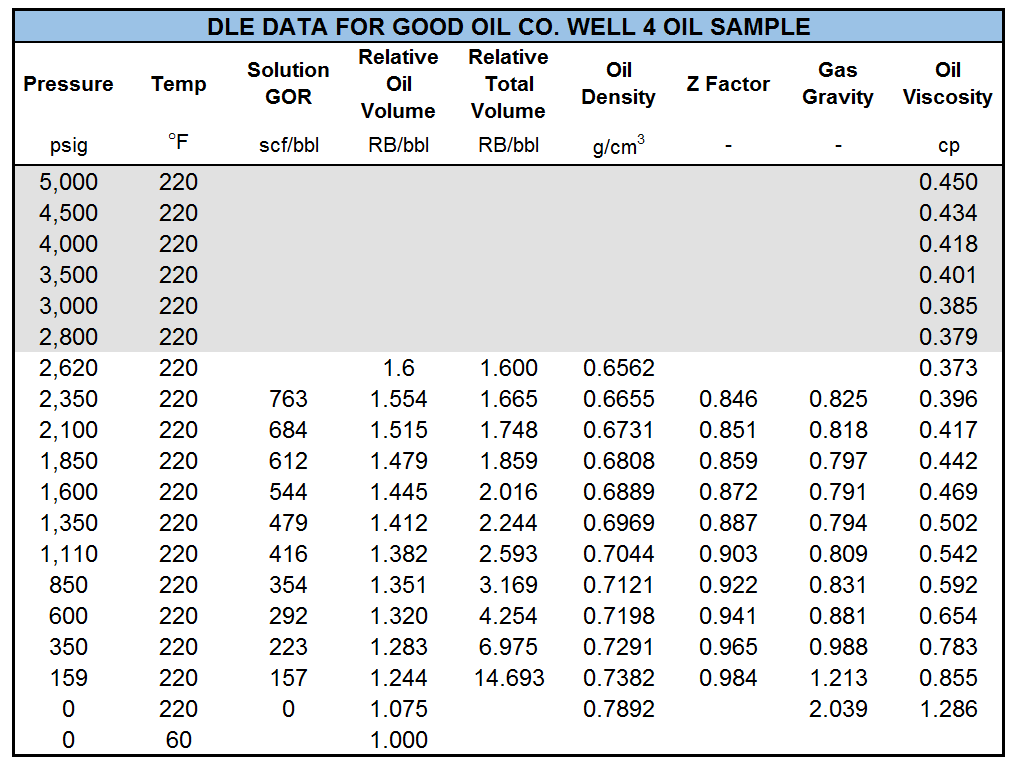
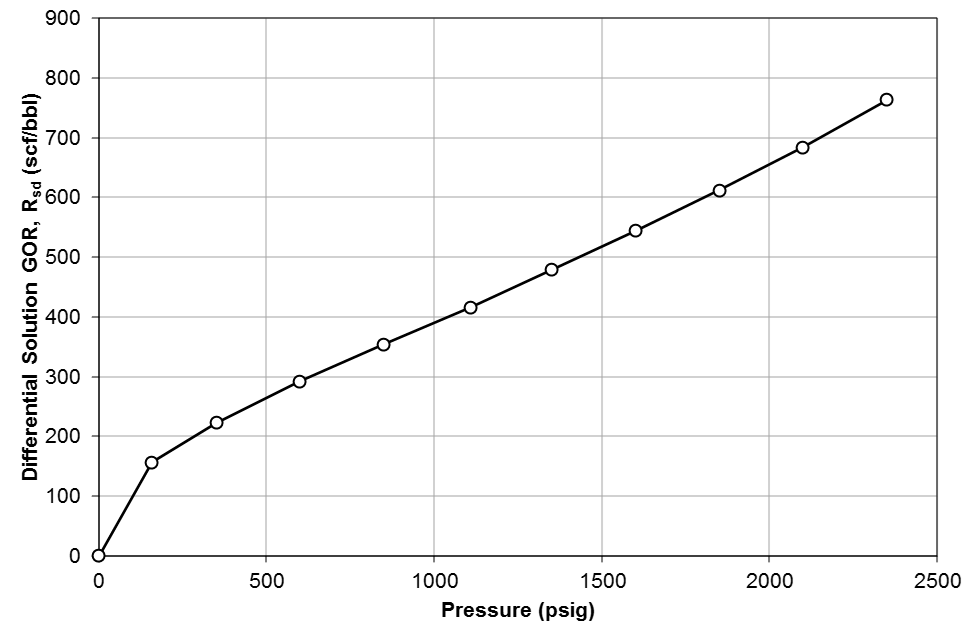
Figure 2: Differential solution gas/oil ratio, \(R_{sd}\) for Good OIL Co. Well 4.
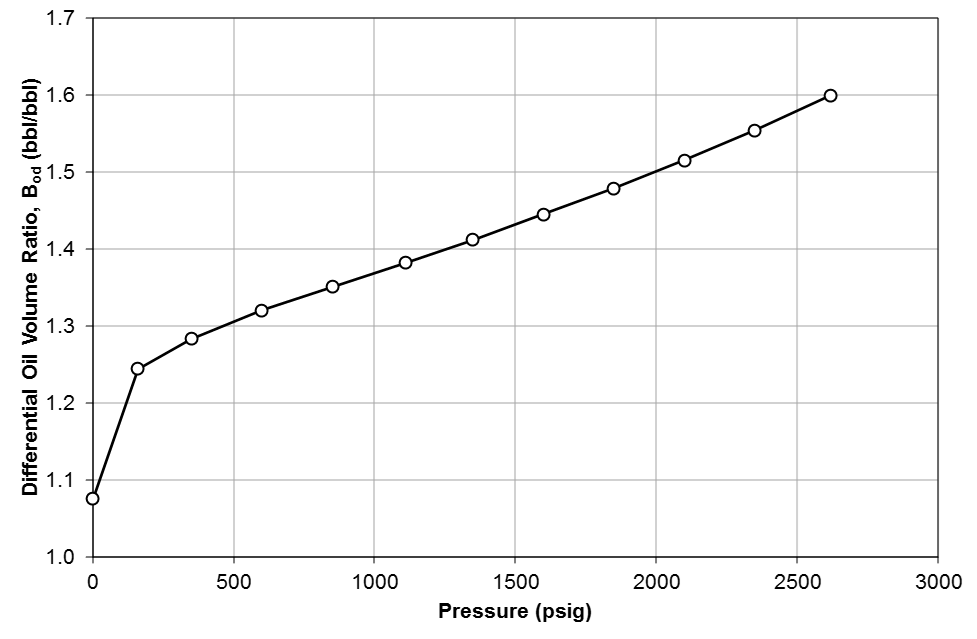
Figure 3: Differential oil FVF (relative volume), \(B_{od}\) for Good OIL Co. Well 4.
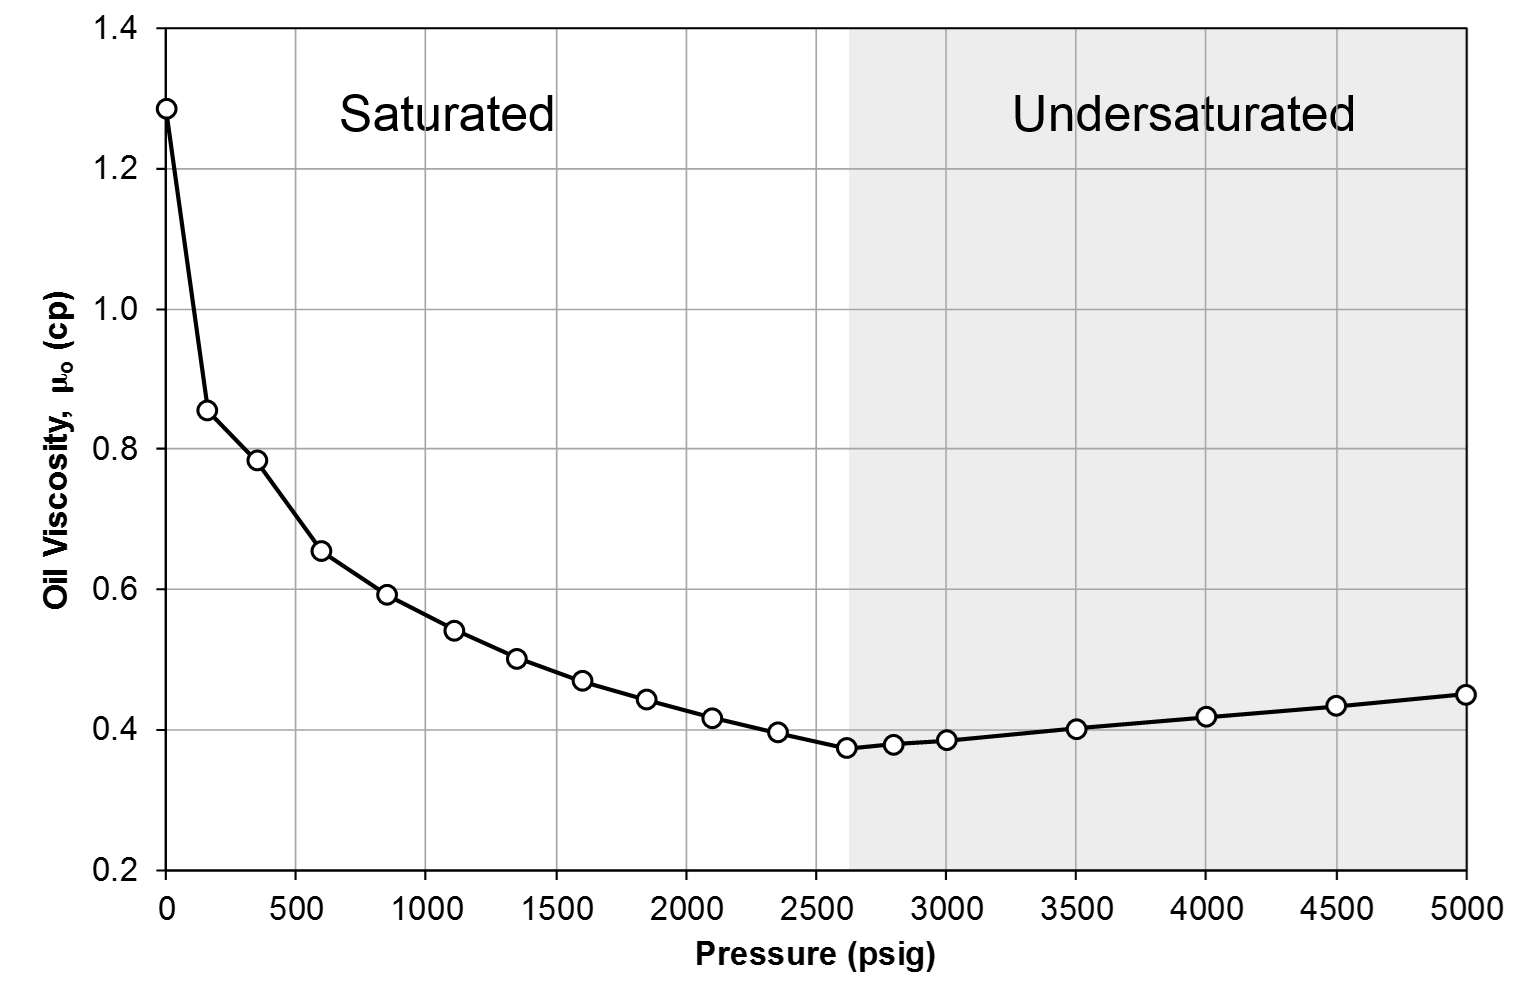
Figure 4: Oil viscosity, \(\mu_{o}\) for Good OIL Co. Well 4.
Quality Control / Quality Assurance
To check the quality of the DLE data, material balance equation is used to back-calculate the oil density and the initial fluid composition. Then, the results are compared with the reported values. At the end, the k-values are estimated and plotted for a visual quality check. Let's do these, step by step.
A template of the DLE test data is shown in the table below.
Table 2 DLE test data template (download Excel file).
Oil Density Material Balance
Starting at the bubble point (stage \(k=0\)) which is 2566 psia in the example given above, the aim of the oil density material balance is to check the consistency of the given data or quality of the reported oil densities.
For stage \(k\), the volume of the removed gas at standard conditions is given by The volume is converted to moles using the ideal gas law.
Using the molecular weight of the gas, that can be calculated from the gas specific gravity measured in the stage, moles are converted to mass.
By combining Equations \eqref{eq:vgd} to \eqref{eq:mgd},
At the last stage \(k=N\), only the residual oil is left in the cell and its mass can be calculated using the measured oil density.
Starting from residual oil and adding differential mass of the removed gas at each stage (going backward from \(k=N-1\) to \(k=0\)), the oil mass at each stage is obtained.
Hence, the oil density at each stage will be given by
By implementing the procedure given above, a plot like Figure 5 will be obtained.
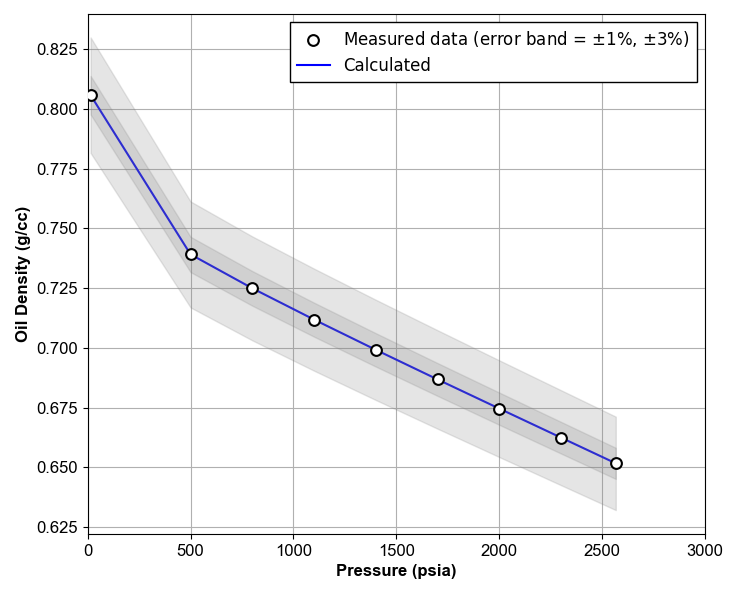
Figure 5: Oil Density QC Example.
Composition of The Original Fluid
To check the quality of the reported composition of the original fluid, material balance equation is used to combine the residual oil and the all gases removed at stages backward to obtain the initial fluid composition.
The material balance equation gives the molar composition of the component \(i\) as
To calculate \((n_o)_{\text{initial}}\), two methods are available: forward and backward material balance.
Forward Material Balance
Initial moles of the oil (at stage \(k = 0\)) is given by \(M_o\) is the molecular weight of the undersaturated fluid (at stage \(k = 0\)) and usually reported by the lab.
Backward Material Balance
Starting from residual oil and adding differential moles of the removed gas backward, the moles at each stage is given by The values of \((n_{gd})_i\) are obtained using equation \eqref{eq:ngd}. Therefore, the initial molar amount of the oil is
K-Values
One way to check the quality of DLE data is checking the k-value plot visually. To calculate the K-values, compositions of the equilibrium liquid and gas phases are required. The gas composition is reported and the liquid composition is calculated using material balance equation.
The molar composition of the component \(i\) in the liquid phase at stage \(k\) is given by Note that \((x_i)_{k=0}=z_i\).
Having \((x_i)_k\) calculated and and \((y_i)_k\) reported by the lab, the K-values are calculated using
By implementing this procedure, the result will be a plot like the illustrated below.
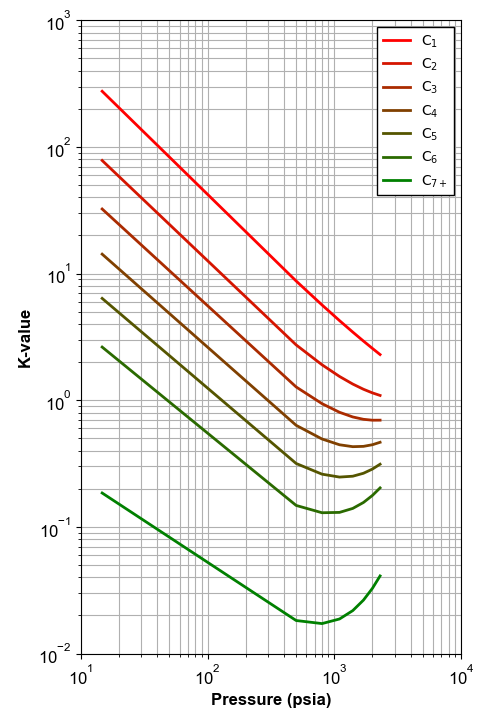
Figure 6: An example of K-values calculated using material balance.
Z-factor QC
For gas samples, the Z-factor is estimated by the laboratories. Estimations of the Z-factor data can be performed as a quality assurance of the laboratory data.
References
-
C. H. Whitson and M. R. Brulé. Phase behavior. Volume 20. Henry L. Doherty Memorial Fund of AIME, Society of Petroleum Engineers …, 2000. ↩